You have probably already figured out that visuals can help you much more than plain text regarding statistics and everything else that concerns numbers. Running a business can be a hard and demanding job, but if you choose the proper tools that can help you reach your goals more quickly and efficiently, your job will become a piece of cake.
We have chosen the five best online chart tools that we certainly recommend, and it is on you to pick the most suitable one.
- wpDataTables
- Redbooth
- ClickUp
- Canva
- Google Sheets
- GanttPRO
wpDataTables

Forget about needing extensive technical knowledge to create beautiful and customizable websites, because wpDataTables comes to the rescue. This WooCommerce product table plugin is an ideal option if you find yourself working with data and charts. Why?
It provides the perfect solution for any WooCommerce website looking to enhance user experience and boost conversions by implementing product comparisons and pricing tables. A customer-centric approach is your best bet to skyrocket sales, and that’s where wpDataTables never ceases to amaze.
wpDataTables is extremely feature-rich and it allows you to either import data from external data sources or enter the data manually. Only the sky is the limit when it comes to creating tables and charts with this WooCommerce Product Table plugin because it’s so easy to create responsive tables without writing a line of code.
Besides being visually appealing, the product tables you create with this plugin are also extremely practical. Once you have the data, you can seamlessly configure and customize the tables and publish them as posts or pages on your WooCommerce website.
Key Features:
- Conditional formatting
- Advanced filters and search
- Editable tables
- Creating tables that allow front-end editing
- Configuring table relations
- Following table filtering in charts
- Table export tools
Pricing:
They offer a free version, while an annual subscription starts from $55 for one domain. You can also buy a lifetime license that starts from $210 for one domain.
Redbooth

Redbooth is among the most popular chart tools that will do most of the work done. With this tool, you will be able not only to make beautiful and useful charts but plan a whole campaign or see client engagement. This way, you can track and monitor your projects and visualize them by using the Gantt charts that are extremely simple and effective.
Redbooth can be used for free, but you can also get a business plan if you wish to expand your user experience. It can be found here: https://redbooth.com/.
ClickUp

ClickUp is primarily a business management tool with numerous features that can simplify your everyday tasks and help you track your projects and workflow. Measuring your success and managing your goals are just some of the essential aspects of this tool. You can make all kinds of charts that will visualize your work and continue doing your thing carelessly.
This tool has different plans, but one of them is free forever, as stated. You can find it here: https://clickup.com/.
Canva
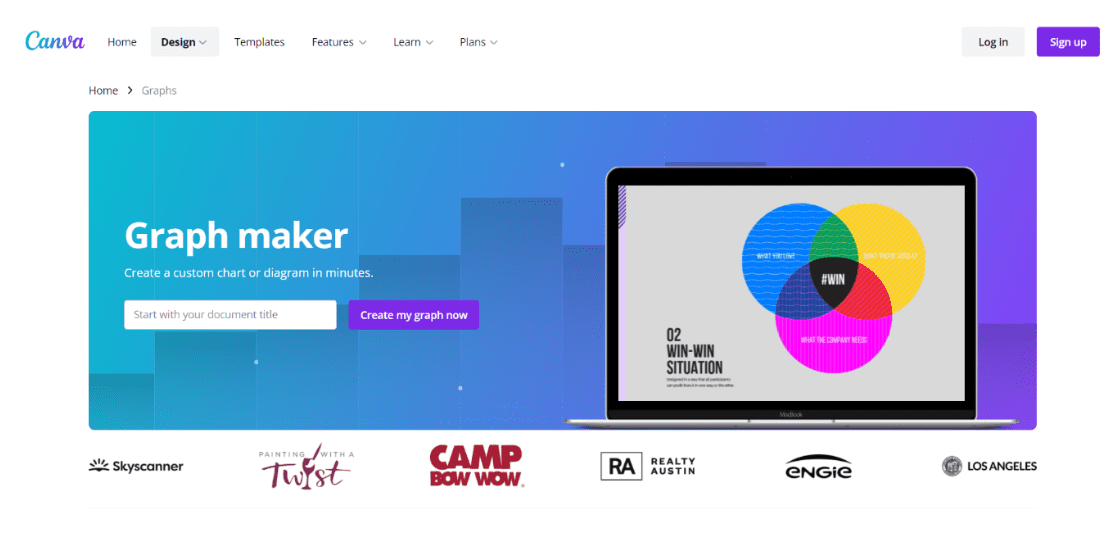
Canva is undoubtedly one of the leading tools for companies all over the world, and it can be used for multiple purposes. One of them is creating astonishing graphics such as charts. With this tool, you can create a diagram or custom chart and visualize your data in only a few minutes.
The software is straightforward but provides professional and well-structured charts to track your workflow and projects. You can choose among various templates, colors, designs, fonts, and more. There is an available free version of it at https://www.canva.com/graphs/.
Google Sheets
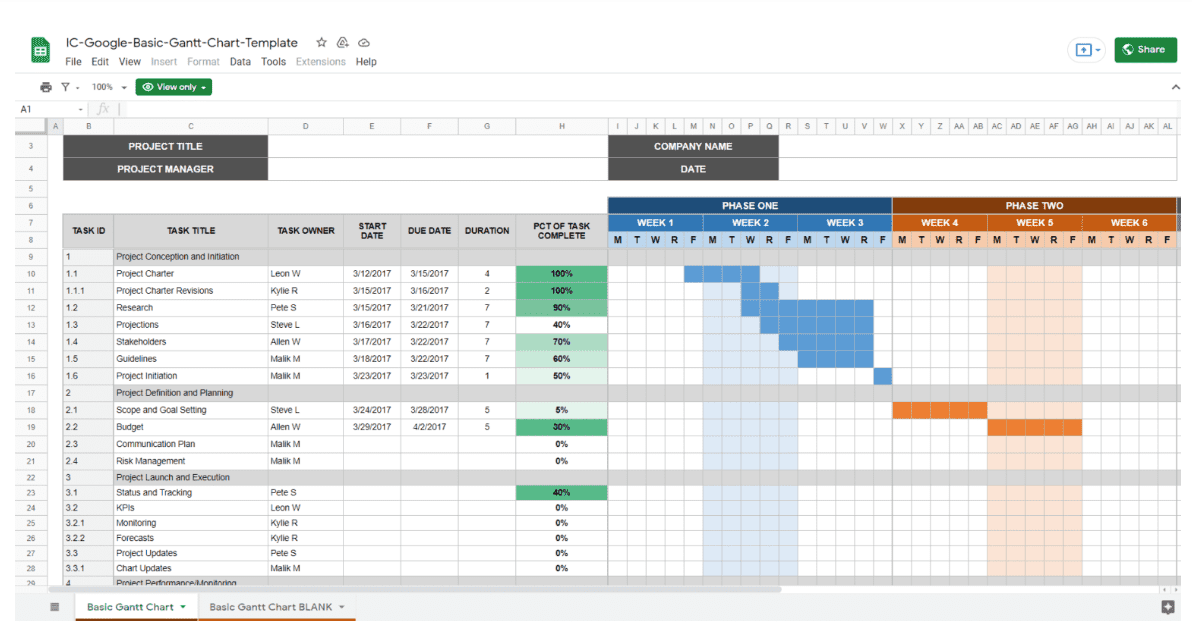
If you want to have all the features available for free, you can always try Google Sheets. Although this tool is mostly used for crunching numbers, it also enables you to create Gantt charts.
There is built-in software for Gantt charts and various templates that you can use and modify according to your wishes and store them in the cloud. It is available at https://www.google.com/sheets/about/.
GanttPRO
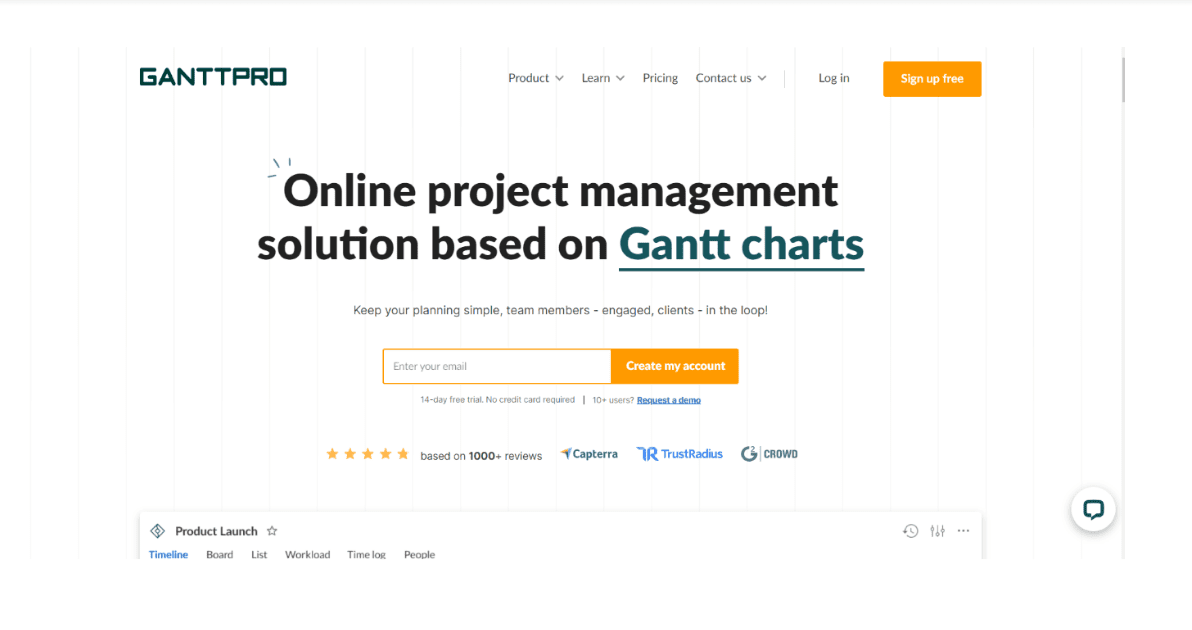
If you are unsure about Google Sheets and other tools, you can always play safely and decide to go with GanttPRO, a tool specialized for creating charts. It is one of the best solutions on the market and will not let you down when it comes to templates, organization, accuracy, and management.
There is also a free trial for this tool, but its basic price is $8,90 monthly. You can find it at the following link: https://ganttpro.com/.
Conclusion
All of these tools have a great reputation and efficiency when it comes to task management and creating charts. If you wish to have a tool that will save you a lot of time, keep stress away, visualize your project and keep track of your business, it is high time you picked out one of these that we recommend.
Published on April 18, 2022 under chart, graph, online tools. Modified on October 30, 2023.