Data analysis is one of the essential parts of your online business, and it will determine the speed of your progress and your overall success. Using tools like an influence diagram can help you visually map out the relationships between different variables, making it easier to understand the impacts of each decision. Going from predicting your user’s patterns and trends, identifying your objectives and future projects, finding new methods of improving, investigating your competition…you may not be fond of that process, but it’s unavoidable if you want to reach your full potential.
These goals can be:
- Getting a better overview of your target audience
- Increase productivity
- Market positioning
- Product evaluation
- Better decision making
with many more benefits in store and ready to be utilized. Analyzing data is of great importance, and it should be done every so often, but there is a big problem with conducting it – how will you resist the urge to fall asleep when you’re not even halfway through? Numbers, equations, complex patterns…it can get obnoxiously boring, and if you decide to ditch it, all of those benefits will go to waste. Luckily, there is a way to spice it up with a little thing called data visualization.

People are much more productive when they get a visual representation of any type opposed to dry text and numbers, especially when it’s so extensive and exhausting. And just like any other WordPress task, your analysis can be simplified by exploiting a proper plugin. By doing so, all of the info you need will be converted into graphs, charts, and infographics where your main focus will be shifted exactly where you need it – cross out the hieroglyphics decoding and start analyzing!
There are hundreds of plugins that can help you carry out this task, with multiple preferences fitting various approaches, and to make your choice procedure much more straightforward, let’s get through top data visualization WordPress plugins.
wpDataTables
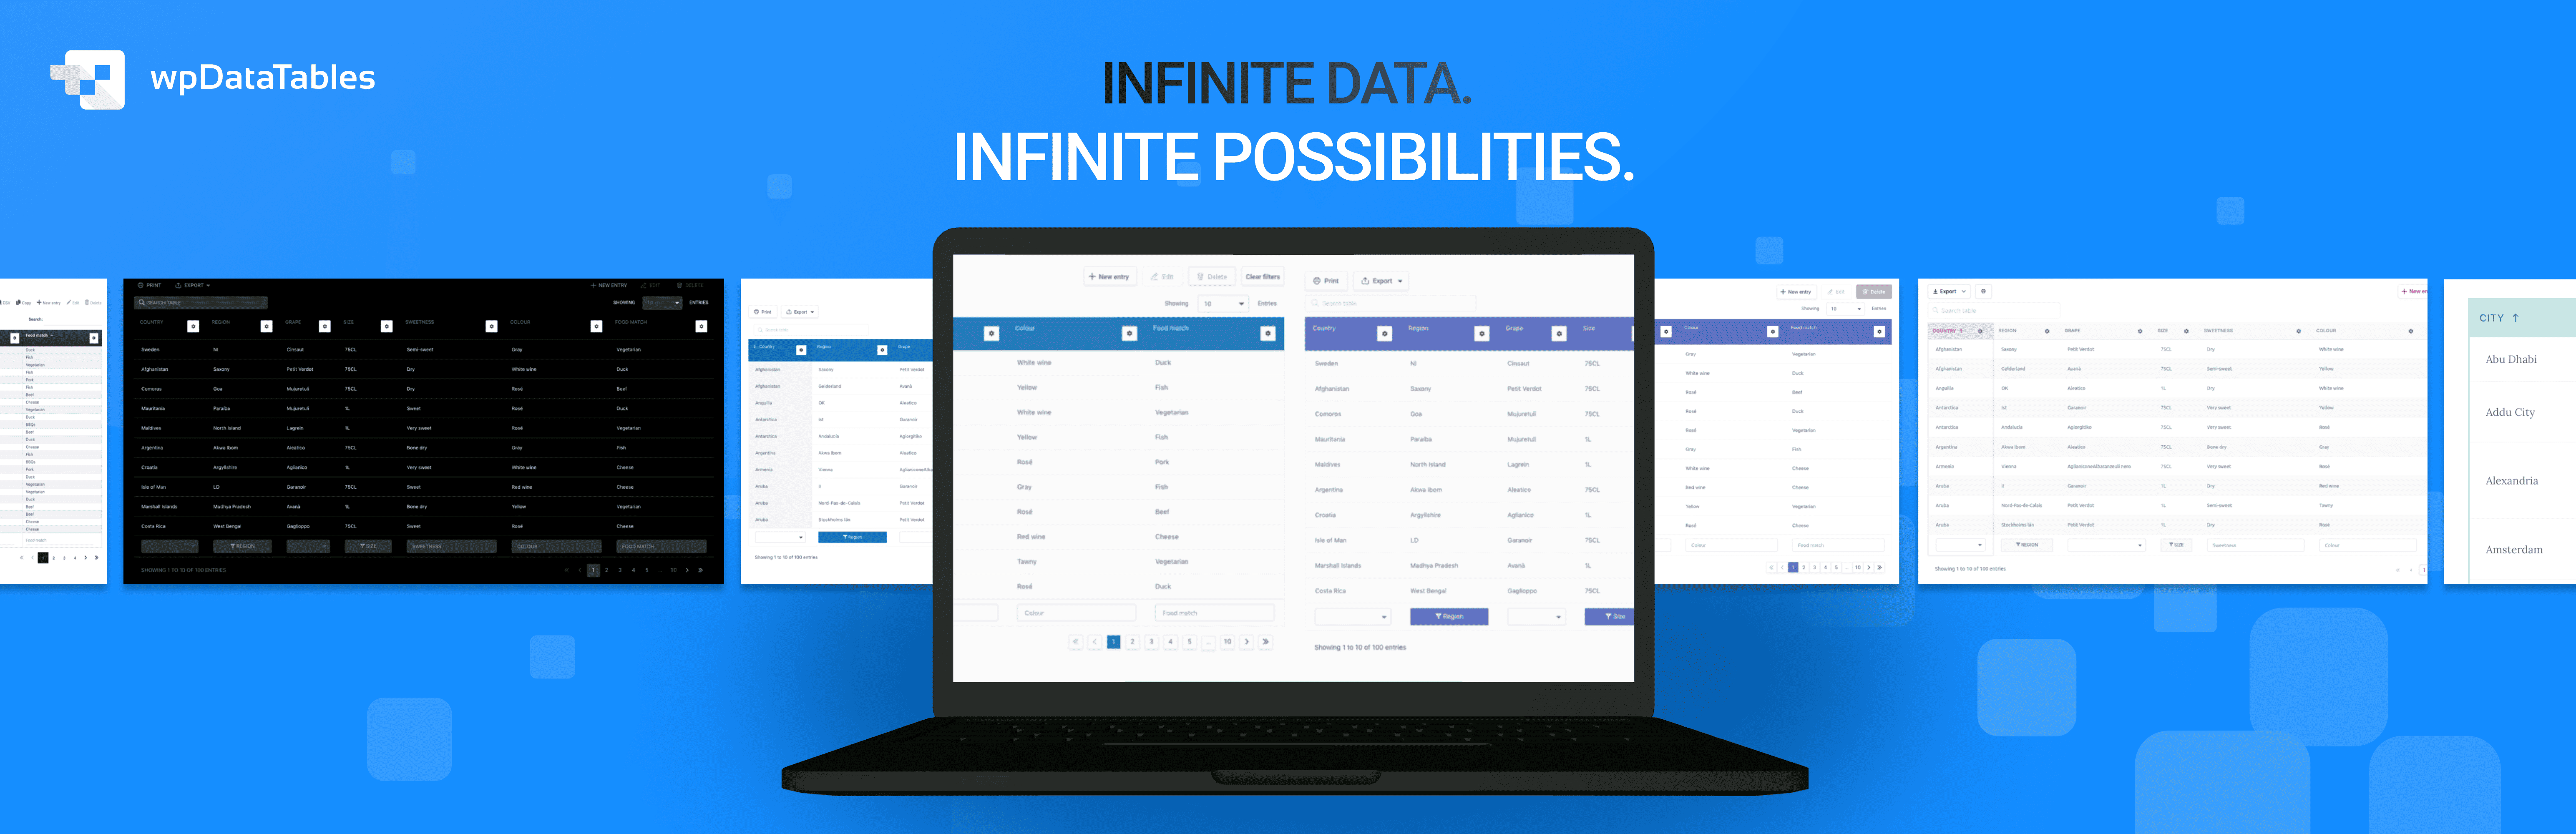
wpDataTables will be a game-changer for your sports website. What sets it apart from other plugins is how simple it is to use and create beautiful tables and charts without wasting time on boring tasks. wpDataTables takes care of all that for you!
You can manually create tables, but what you’ll like even more is that you can import data from external sources. This allows you to always have up-to-date information and attract more visitors to your website.
With this league table WordPress plugin, you can also generate a graphic representation of statistical data as charts. Large tables don’t have to cause you headaches, because wpDataTable handles them without hassle. You can also develop individual filters for your dataset to narrow down the data in your WordPress table.
Have we mentioned that you can also highlight columns, rows, or individual cells? It works perfectly well for any sports website.
Key Features:
- Editable tables
- Conditional formatting
- Responsive WordPress tables and charts
- Integer columns
- Following table filtering in charts
- Customizable tables
Price:
Annual subscription: $55 for one domain.
Lifetime license: $210 for one domain.
Formidable Forms

We kick things off with a very powerful tool that will erase all of your data analysis worries and leave you with only the info you crave. It functions on the fan-favorite drag & drop builder, which makes its usage simple and easy to learn, with multiple builders available for making forms, quizzes, surveys, contact forms, and many others. It’s well suited for all devices, so there will be no issues with running it on desktop, laptop, or mobile. When it comes to features of this plugin, here’s what you can expect:
- Visual styler
You can adjust it to your theme and customize the appearance to perfection
- Premade templates
Including calculators, payment forms and WooCommerce forms
- Integrated Views
Utilize the ability to transform entries into directories, calendars, listings or front-end content
- Reports, Graphs, and Charts
The feature you’ve been waiting for – everything is customizable and visually appealing
- Import and Export
All of the data can be transferred to another site or imported for further adjustments
Those are only a few features with many more in stock. With that many options to choose from combined with phenomenal versatility, you’re guaranteed to create the best data analysis possible. You can download it for free or purchase a Premium version with even more features for a price starting at $99/year.
Visualizer

Highly customizable, straightforward, and efficient are a few epithets that embellish this exceptional plugin. Visualizer is a robust plugin with more than enough power to create stunning tables and charts, but still very simple to use. It offers a variety of chart types – 9 of them to be precise (with six more available in the PRO version), with an excel-like editor, suited for both browser and mobile, and compatible with all free and premium WordPress themes. Some of the features this plugin offers are:
- Interactive Charts
With the colors, design, and animation being fully customizable
- Automatic Data Sync
From online files such as Google Sheets or CSV, or databases
- Instant editing
With an ability to preview the charts in real-time
- Permission control
Choose who can see and edit the charts, with many more waiting to be utilized. You can download Visualizer for free or go for even more features and variations by purchasing the PRO plan, with a price starting at $63/year.
WP DataTables

Front-end and back-end customizations for creating stunning charts and tables accompanied with tons of useful features are what this WordPress tables plugin is all about. WP DataTables allows you to easily create them from multiple sources, including Excel, CSV, PHP, and others. They offer a real-time editor on their website, which is definitely a touch of real class, where you can choose your preferences and get the general idea behind the usage of this plugin. It’s responsive, meaning that it will fit on any device, offers personalized filters, everything is editable. It includes all pieces that the perfect data visualization plugin should consist of. Some other features include:
- Chart creating wizard
- Excel-like table editing
- Data sourcing
- Allowing users to view and edit
- Widget filters
- Design customizations
And that’s only scratching the surface. You can choose between a free plan or a PRO version, basing on your needs and preferences. The PRO version starts at $59 per year.
Data Tables Generator by Supsystic
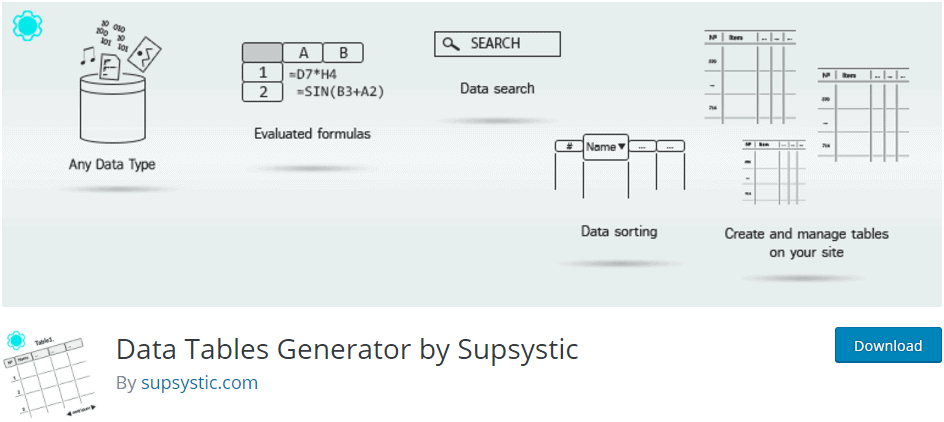
Another remarkable plugin for creating responsive tables with countless customizations and advantages is Data Tables Generator by Supsystic. Graphs, charts, sorting, filtering, list views, order forms…you name it, and they will have it. Apart from its simple usage and exceptional information structuring, it offers amazing designs, responsiveness and is so feature-packed that you’ll be impressed, guaranteed! Don’t believe me? Here we go:
- Data formatting
- Calculations
- Merging cells
- Unlimited rows and columns
- Sorting and searching
- Text, images, links, and comments
- Live preview
- Highlighting
- Compact table
And a dozen more in the PRO version (yup, all of those and many others are included in the free version), so if “packed with features” is your most important criteria while picking the ideal one, this should definitely be your plugin of choice.
Easy Charts

Last but certainly not least, a top pick list can’t be completed without a plugin reserved for a minimalist approach to satisfy users that choose speed and agility over numerous features. But of course, that doesn’t mean that you’ll lack any needed tools to create the perfect data analysis visual.
Firstly, you are able to choose between 12 different chart types (Bar Chart, Area Chart, Pie Chart, Line Chart…), which are interactive and customizable for adding multiple charts to your website, and you can switch between different ones without any data being lost in the process. It includes a live preview of charts so your customizations can be easily inspected. Furthermore, it’s integrated with various design and color templates, charts are downloadable as an image and easily embedded to posts or pages. Simple, elegant, and completely free!
Conclusion
Performing data analysis can reveal details about your business that can heavily influence your strategies and plans for future projects. It brings so much value to the table that you simply must exploit those benefits, and with a proper plugin by your side, that process will be a piece of cake. Choose the one that fits your desires and start rocking those reports in the easiest manner possible!