Have a lot of data you need to present, but the last thing you want to is to give a boring presentation with mountains of data only you and a handful of others will show some interest in?
You need an infographics builder. These handy tools can help distill heaps of analytical data and make it more digestible and easy to understand for most people.
In addition to that, infographics are also more engaging and provide you with an easier way to present all those numbers. However, sometimes creating them can take quite a while, especially if you want them to look visually appealing.
Canva Infographic Maker
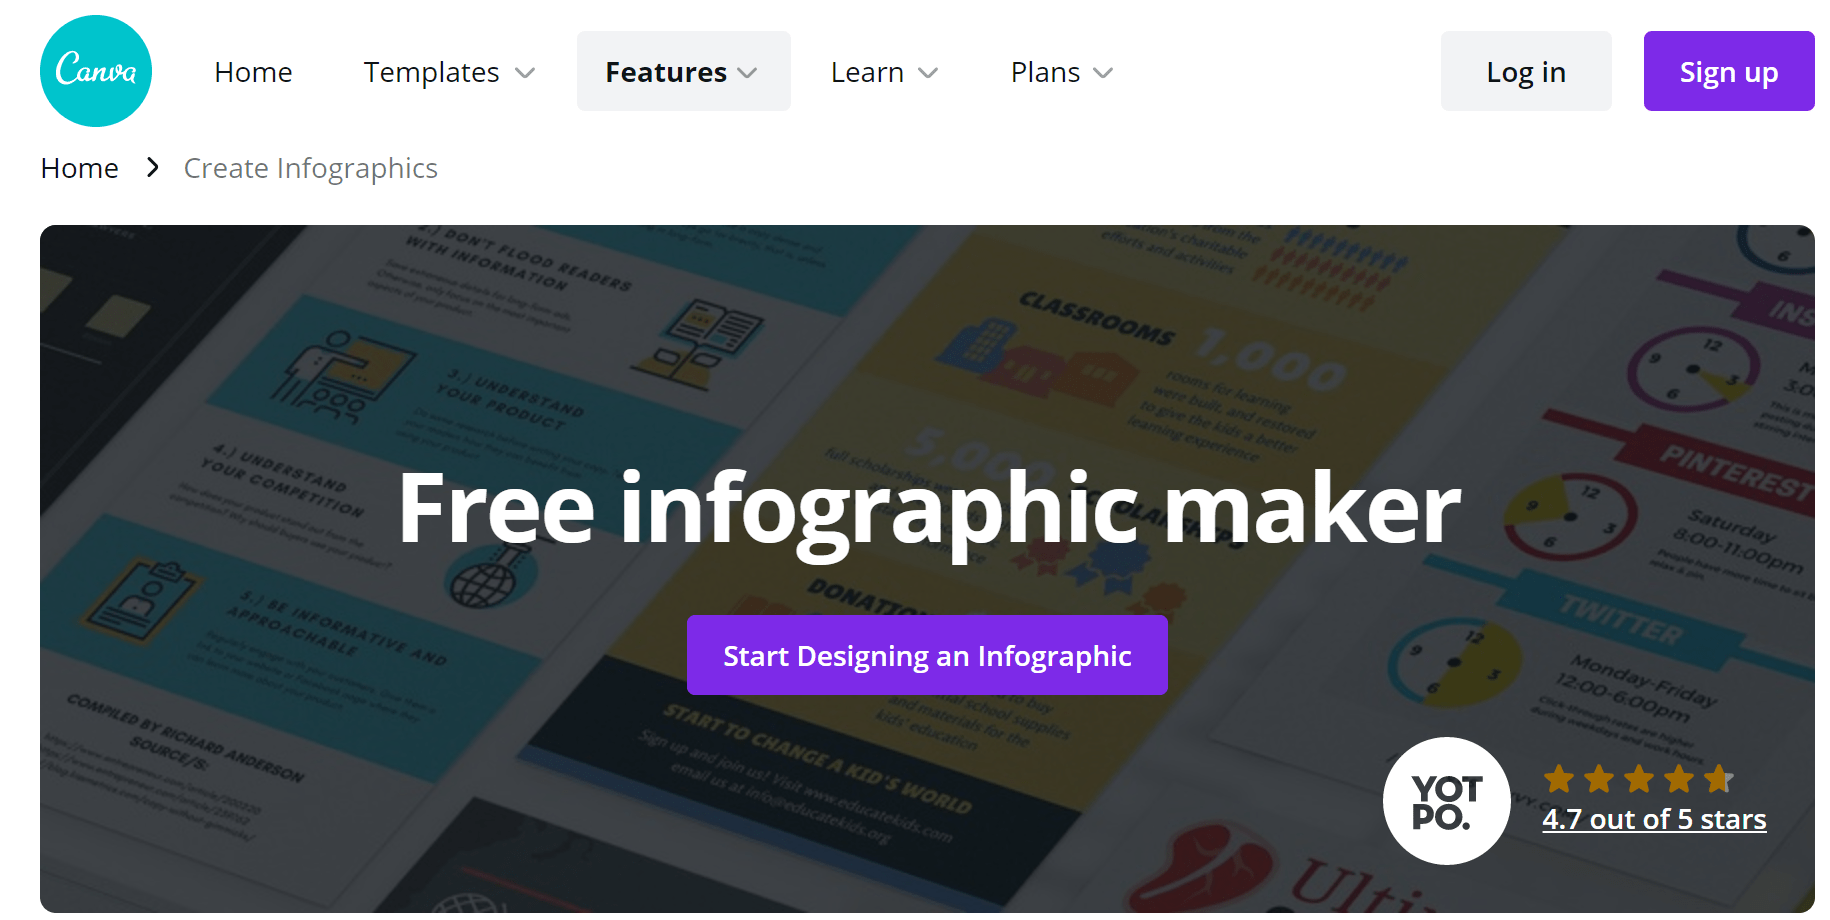
Canva is a rather popular tool as is, and it offers so much more than just creating infographics. The tool provides a handful of ready-made templates suitable for any occasion that are also easy to customize. But if you’re looking for something that looks great, takes only a few minutes to make, and is free, then look no further than the first entry on this list.
This is the best choice for all those with minimal or no experience in design.
When browsing for a template, the choices can be narrowed down through various filters by theme, style, color, etc. Once your mind is settled on the perfect one, you can change the font, the text size, as well as browse Canva’s vast library of images, vectors, and illustrations. When you’re happy with the design, just download it and print, send or share, whatever you want.
As was alluded to before, the basic version of Canva’s infographic maker is entirely free. However, some of the features and a lot of the images and illustrations are considered premium features and are hidden behind a paywall. So, if you’re looking for the whole package, you might have to upgrade.
Adobe Spark
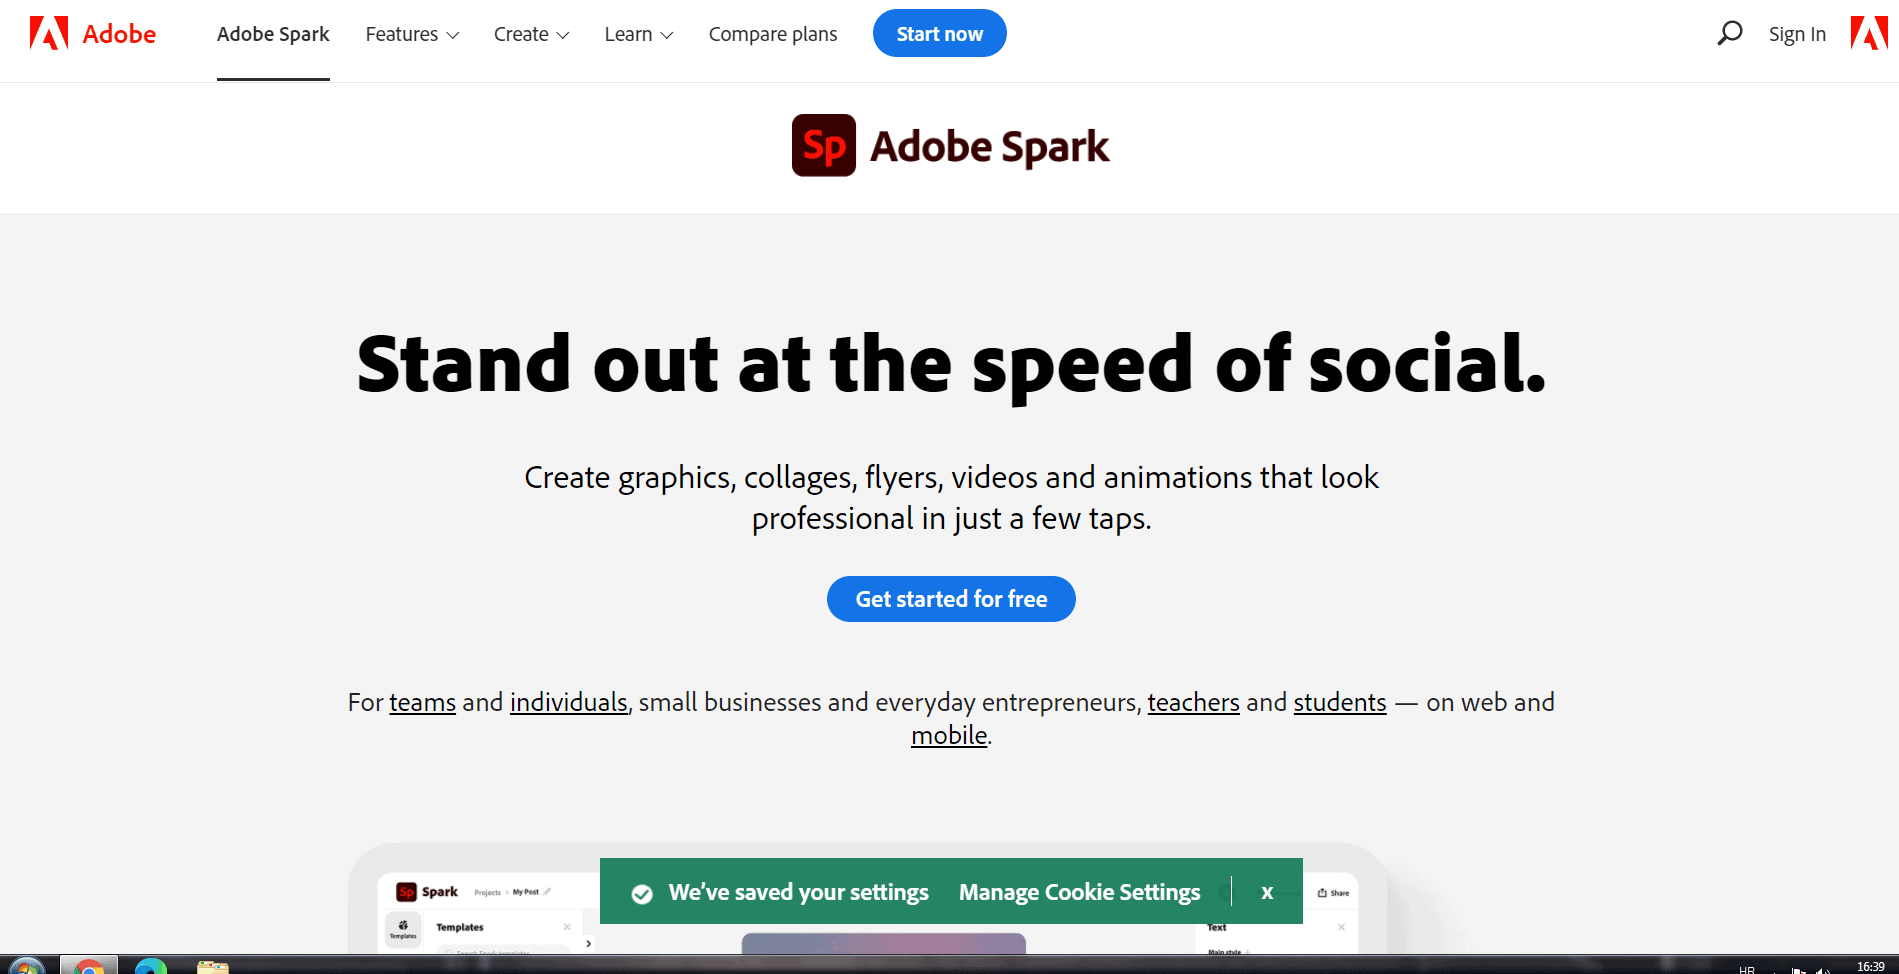
Much like Canva, Adobe Spark is so much more than just an infographics tool, but unlike Canva, the design software is a tad more advanced. This means that while you’ll have more control over your overall design, you’ll also have to know what you’re doing not to mess up the chosen template. The drag-and-drop editor streamlines the design process and allows the user to quickly modify and adjust any part of the template according to their desires and taste.
There are heaps of customization options to play around with, but a great deal of them is only available within paid-for plans. Other than the customization options, what makes Adobe Spark great is resizing and adjusting the graphic to work in social media posts. In addition, this tool also lets you store your creation on the cloud.
While the free version offers many features, and you’ll have absolutely no problem creating something stunning with it, the best-looking templates are only available in the paid-for plans, and the free version does put a watermark on whatever you make. The prices for this tool start at 99.99$ per year for an individual plan.
Visme
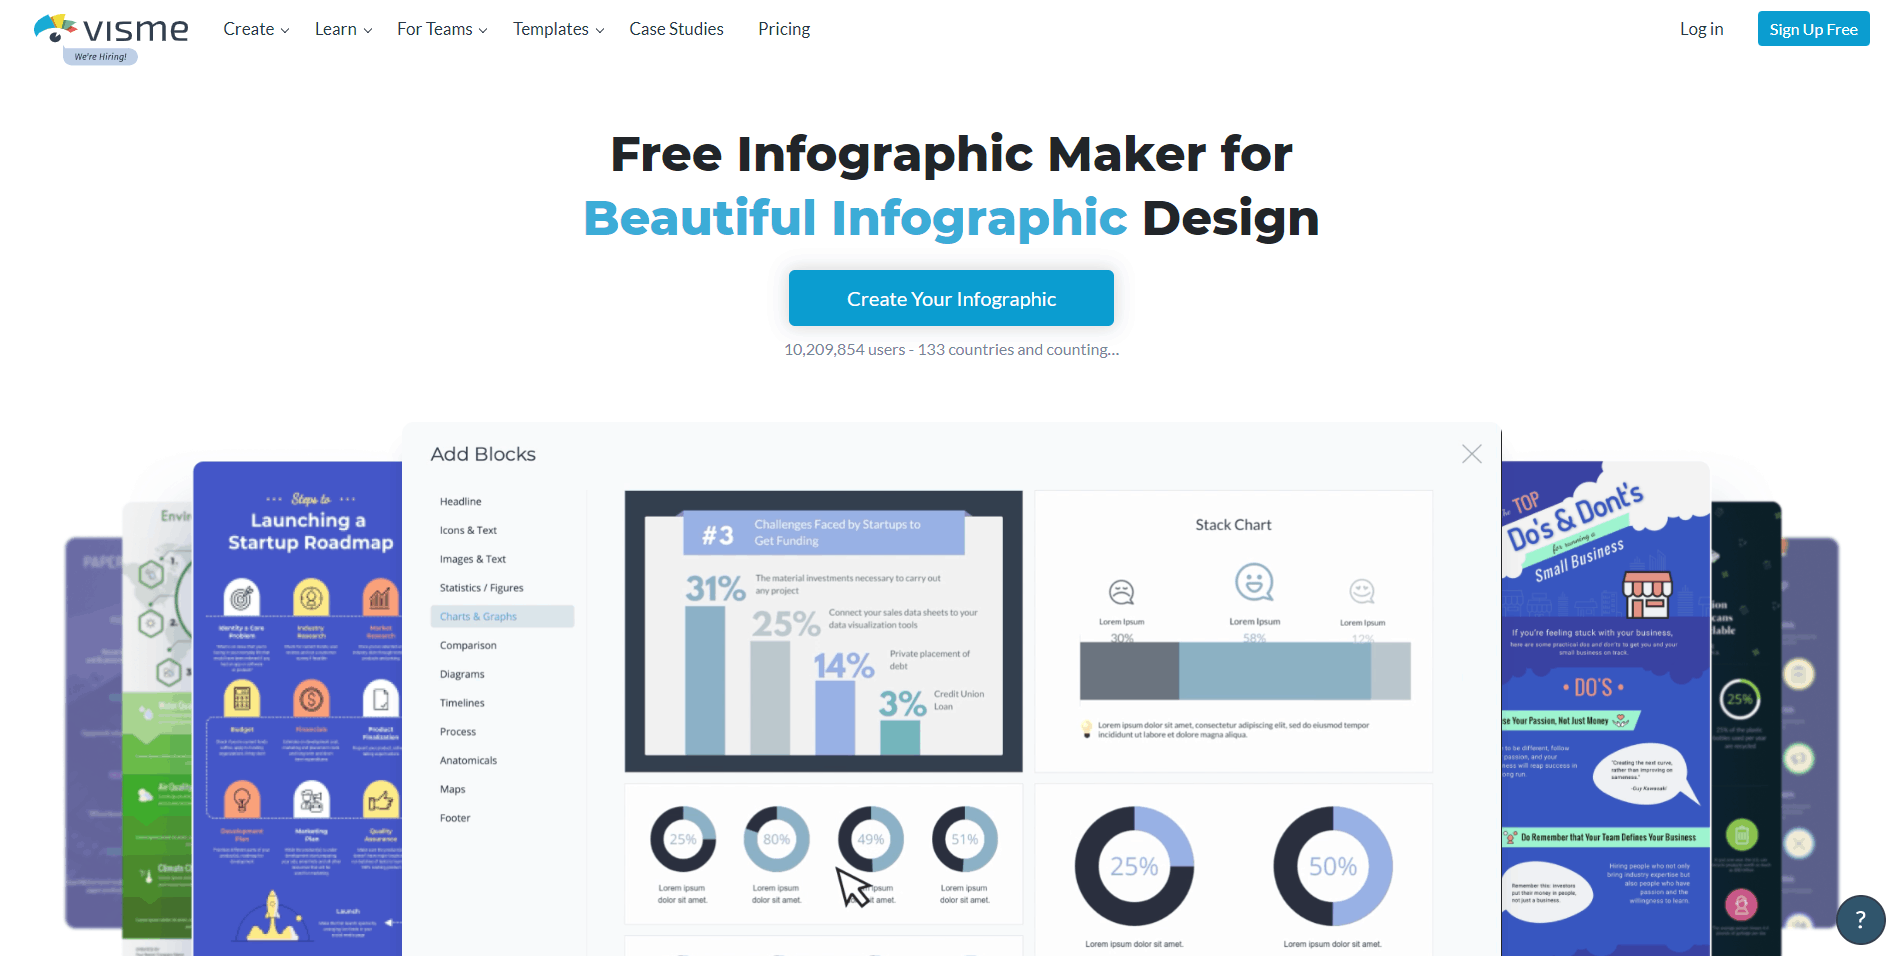
Visme is ideal for those that want pretty much everything pre-made and have little to do with design themselves. It’s very focused on the visual aspect and can also be used to create video presentations, but its main focus is engaging infographics. This tool comes with a myriad of free fonts, images, and high-quality icons that can drastically improve any project. In addition, it also allows for the addition of audio and or video, and there’s even an option of adding a voiceover directly from the editor, which can be handy if you need to present the material in front of a lot of people.
The content you put in can also be animated to make the whole thing that much more interesting. The drag-and-drop editor is easy to work with, and even non-designer can play around with it as it really is that simple. In essence, this tool can help you tell a story through what you create, and if that’s what you’re looking for, make sure to check it out.
The only downside of Visme is that if you choose to opt for anything other than the free version, it can get quite expensive. The prices for individual users start at 15$ per month when billed annually. This is quite a lot compared to our first two recommendations, but if you plan on working with animations and audio and video files, it is worth the money as these are scarce features when it comes to infographics tools.
Easel.ly
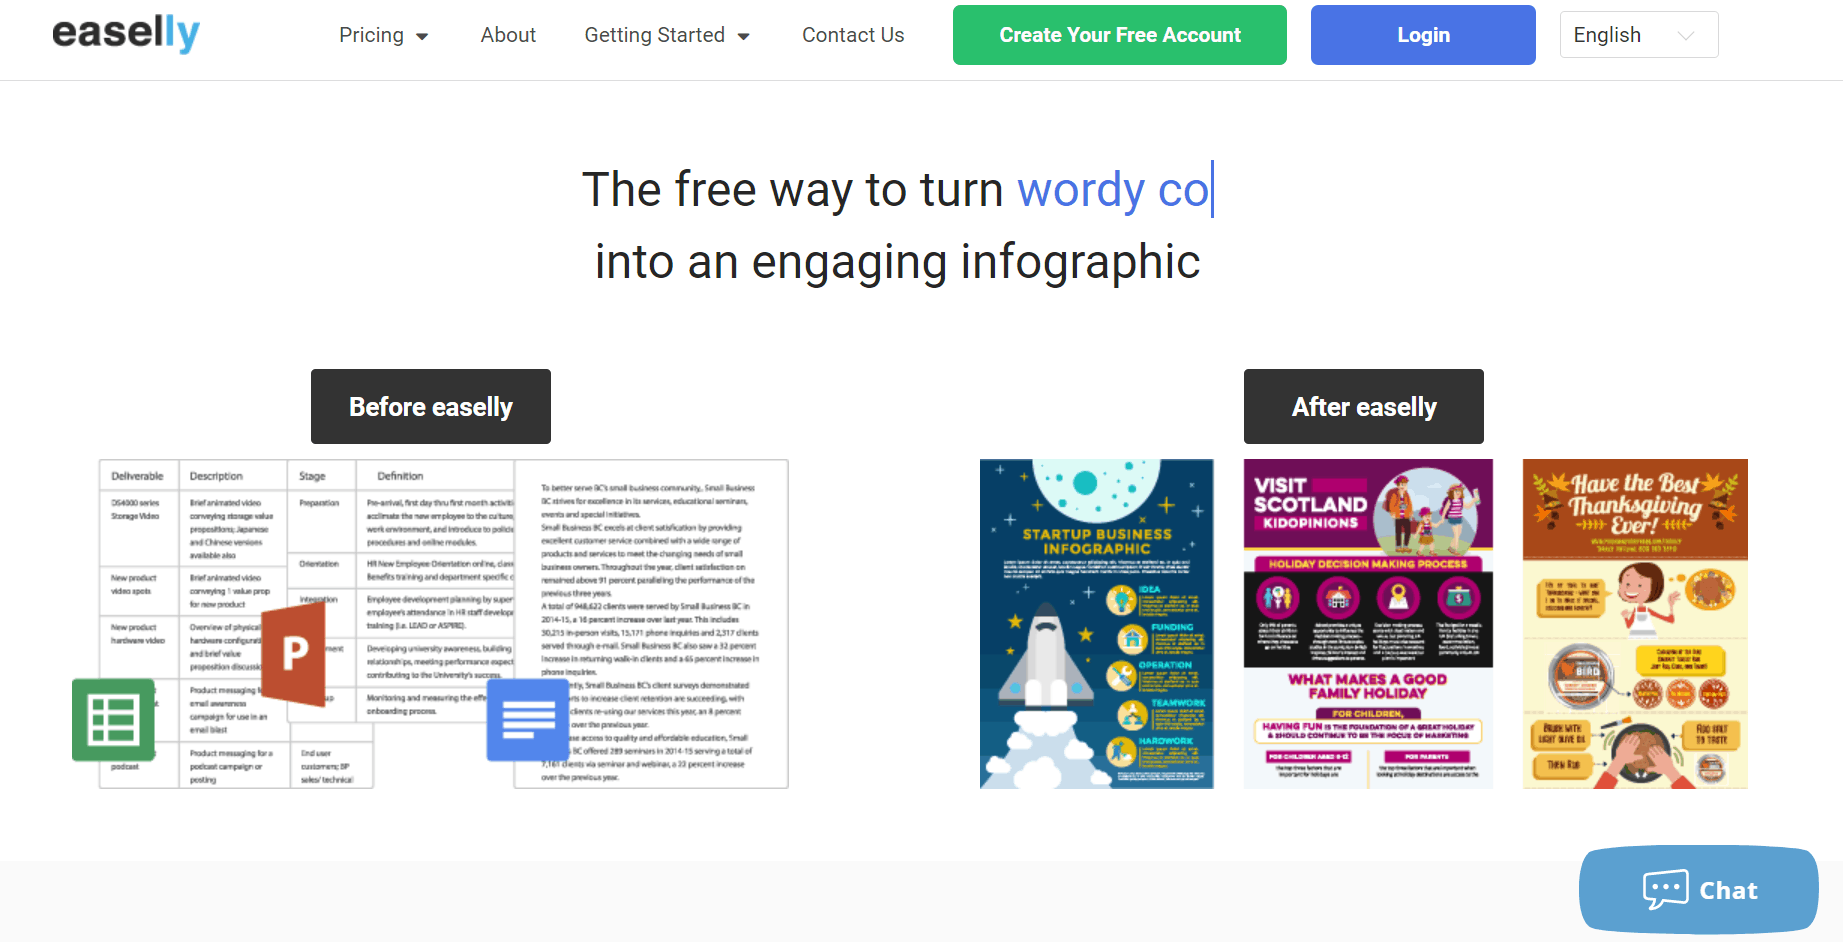
Unlike the other tools on our list, Easl.ly doesn’t offer a free version at all, but the upside is that the prices for it start at only 2$. This could be an excellent choice for those that want a complete premium version of a design tool, but their budget doesn’t allow for big spending. Easel.ly comes with over 320 premium templates, over one million photos, and various images, and you can export your infographics in PDF, JPEG, and PNG.
Another great thing about this tool is that it allows you to upload your own graphics, designs, and photos, so if there’s something particular your graphs need to have, you’re more than free to add it. There are some limitations as far as customization is concerned, and when you first open the editor, it can be a little confusing and hard to get around. But, once you get a feel for it, there should be no issue whatsoever.
Plus, if you’re not the most creative of people but want an engaging chart or infographic, Easel.ly even offers design help provided by experts and has great customer service.
Wrapping Up
Unless you’re a huge maths buff, data is boring to most people. But there are ways to dress it up and make everyone more interested in stats. Make your data more digestible and eye-catching by opting for a great infographics tool. Every single one we listed today is fairly easy to use and allows you to create something great within minutes. So, best of luck and get creative!
Published on July 15, 2021 under infographic.